Management / Articles
Ishikawa Diagram: what is it, why it matters, when to use it
Learn what the Ishikawa Diagram is, how the 6M method works, and how to use it to identify root causes in industrial processes.

 12 minutes of reading
2026-08-13 12:03:49
- The Ishikawa Diagram, also known as the Fishbone Diagram, helps teams map the possible causes of a problem and organize them into clear categories.
- In industrial environments, it can be used to investigate issues such as low washing capacity, recurring defects, downtime, contamination risks, or inconsistent results.
- To be effective, the diagram should be supported by data, followed by cause prioritization, and converted into corrective actions with owners, deadlines, and KPIs.
It all started with a modest fishbone. It was this unmistakable structure that inspired a Japanese engineer to create a simple way of representing persistent problems – and their multiple causes, sub-causes and sub-sub-causes.
It was precisely this complexity, which traditional analytics could not resolve, and the need for prioritization and communication, that drove this practical methodology.
For companies with demanding washing, hygiene, and production requirements, the same logic can help teams understand why a process is not delivering the expected quality, capacity, or consistency.
Find out what the Ishikawa Diagram is and how it can help solve problems in your organization.
What is the Ishikawa Diagram?
The Ishikawa Diagram is a visual continuous improvement tool that helps identify the causes of a problem. It is also known as a Fishbone Diagram because of its graphical format.
It is filled from right to left, with the problem, or effect, placed at the far right, on the head of the fishbone. From there, the bones irradiate to the left, starting from the major bone that is represented as a horizontal line.
Along that line, six more lines are drawn, three above and three below. These lines represent the major possible types of causes, so that no factor is overlooked:
- Machinery. This category considers the potential causes associated with the incorrect operation of tools and equipment, such as outdated programs, malfunctioning components, or machines with low throughput.
- Materials. Included here are problems related to raw material, such as materials that are not compliant with job requirements or are incompatible with the process.
- Mother Nature. This category encompasses environmental factors that may favor the problem, such as high temperatures, lack of space, poorly optimized layout, or noise.
- Manpower. Problems can occur because of poor allocation of employees or difficulties they may encounter while performing their tasks, such as lack of training or control.
- Method. The working methods used during processes may also contribute to the problem. It is important to consider whether documented production processes exist, whether they are adequate, and whether they are up to date.
- Measurement. This category covers causes involving the metrics used to evaluate the work, such as the reliability of calibration instruments or inadequate production parameters.
Despite these categories, the Ishikawa Diagram can be adapted to the reality of each company. It may be necessary to add more “bones” or even remove them, as need be. Inside each of these six categories, also known as 6M, the most important root causes are identified. To do that, the team dealing with the problem on a daily basis should ask, “Why does this problem occur?”, and do so repeatedly until they identify the root cause.
Then, simply place that root cause on the Diagram in the most appropriate area. In the end, for a given problem, it should be possible to identify the Top 10 most critical causes – those that if solved, will cause the problem to stop happening at all, or minimize it significantly.
Benefits of the Ishikawa Diagram
The Ishikawa Diagram allows you to identify, organize, and share the causes of a given problem, defined in different categories, facilitating analysis and resolution. The major advantage is the immediate and intuitive display of complex root causes. This makes it easier to navigate the problem, while ensuring that no category is forgotten. The higher the level of detail, the deeper and more complete the understanding of the problem – just don’t overdo it, or you’ll lose the big picture.
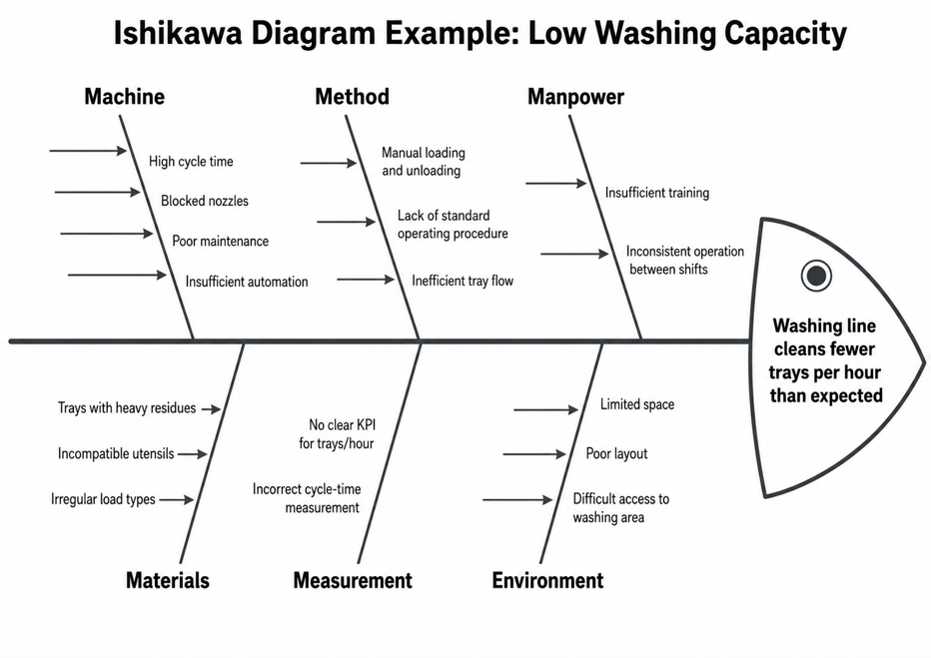
Imagine applying the Ishikawa Diagram to a washing process that is cleaning fewer trays per day than expected. The problem should be specific: for example, “the washing line is delivering 20% fewer clean trays per shift than planned”. From there, the team can map possible causes across the 6M categories.
- Machine: high cycle time, blocked nozzles, insufficient maintenance, inadequate program selection, or equipment that no longer matches production volume.
- Method: manual loading and unloading, poor tray organization, lack of standard work, or inefficient separation between dirty and clean flows.
- Manpower: limited operator training, different practices between shifts, or lack of clarity on how to report washing problems.
- Materials: trays with heavy residues, incompatible utensils, or mixed items that require different washing parameters.
- Measurement: no reliable KPI for trays per hour, rewash rate, downtime, cycle compliance, or production delays caused by unavailable clean items.
- Mother Nature: limited space, poor layout, difficult access to the washing area, or environmental conditions that make the process harder to control.
This example shows why the diagram should not stop at brainstorming. Each possible cause needs to be validated with data, observations, operator feedback, maintenance records, and washing results.
Also, even after a problem has been solved, the Ishikawa Diagram often exposes other weaknesses that had not yet been foreseen, allowing staff to correct them before they cause more permanent problems.
When should you use an Ishikawa Diagram?
An Ishikawa Diagram is useful when a problem is recurring, complex, or affected by several possible variables. It is especially helpful when teams are treating symptoms instead of causes, or when there is no shared view of why a process is failing.
In industrial washing, it can be applied to issues such as low washing capacity, repeated rewashes, equipment downtime, inconsistent cleaning results, excessive consumption of water or detergent, or production delays caused by unavailable clean items.
How to use the Ishikawa Diagram?
Although seemingly very simple, using the Ishikawa Diagram effectively requires some ground rules, especially when it is done as a team – as it should.
- Clearly define the problem to be analyzed, preferably with data.
- Draw a horizontal arrow pointing to the right and add a square at the end.
- Write the problem inside this square.
- Draw diagonal lines around the body of the arrow to contain the 6M: Machines, Materials, Mother Nature, Manpower, Method, and Measurement.
- Gather the team together and brainstorm to define potential causes.
- Enter the causes found, listing them according to severity or importance.
Ishikawa Diagram vs. 5 Whys
The Ishikawa Diagram and the 5 Whys are complementary tools. The Fishbone Diagram helps teams organize all possible causes of a problem across different categories. The 5 Whys helps them go deeper into one cause to understand the root reason behind it. A good approach is to use the Ishikawa Diagram to map the problem and then apply the 5 Whys to the most likely or most critical causes.
Common mistakes to avoid
An Ishikawa Diagram is most useful when it helps teams move from a broad problem to a clear understanding of its possible causes. However, if the exercise is rushed or based only on assumptions, the diagram can become too generic and fail to support real improvement. To make the analysis more effective, teams should avoid the following mistakes:
- Defining the problem too vaguely, such as “low productivity”, instead of using a measurable deviation, such as “the washing line is cleaning 20% fewer trays per hour than expected”.
- Mixing causes with solutions before the real root cause has been validated. At this stage, the goal is to understand why the problem is happening, not to decide immediately what should be changed.
- Building the diagram only with opinions, without checking process data, maintenance records, quality checks, cycle-time measurements, or observing the work area directly.
- Not involving the people who operate, maintain, or control the process every day. Operators, maintenance teams, supervisors, and quality teams may each identify different causes.
- Creating the diagram but not converting it into corrective actions. Once the most relevant causes have been identified, they should lead to clear actions, responsibilities, deadlines, and KPIs.
FAQs about the Ishikawa Diagram
Here are some of the most common questions about the Ishikawa Diagram.
What is another name for the Ishikawa Diagram?
The Ishikawa Diagram is also known as the Fishbone Diagram or Cause-and-Effect Diagram. These names refer to the same visual tool: a diagram that places the problem at the head of the fish and organizes possible causes along the bones.
What are the 6M of the Ishikawa Diagram?
The 6M are Machinery, Materials, Mother Nature, Manpower, Method, and Measurement. They help teams look at a problem from different angles and avoid focusing only on the most obvious cause.
Can the Ishikawa Diagram be used in industrial washing?
Yes. It can help analyze washing problems such as low capacity, inconsistent results, repeated rewashes, downtime, excess consumption, or delays caused by unavailable clean utensils, trays, tools, filters, or parts.
Somengil, continuous improvement in industrial washing
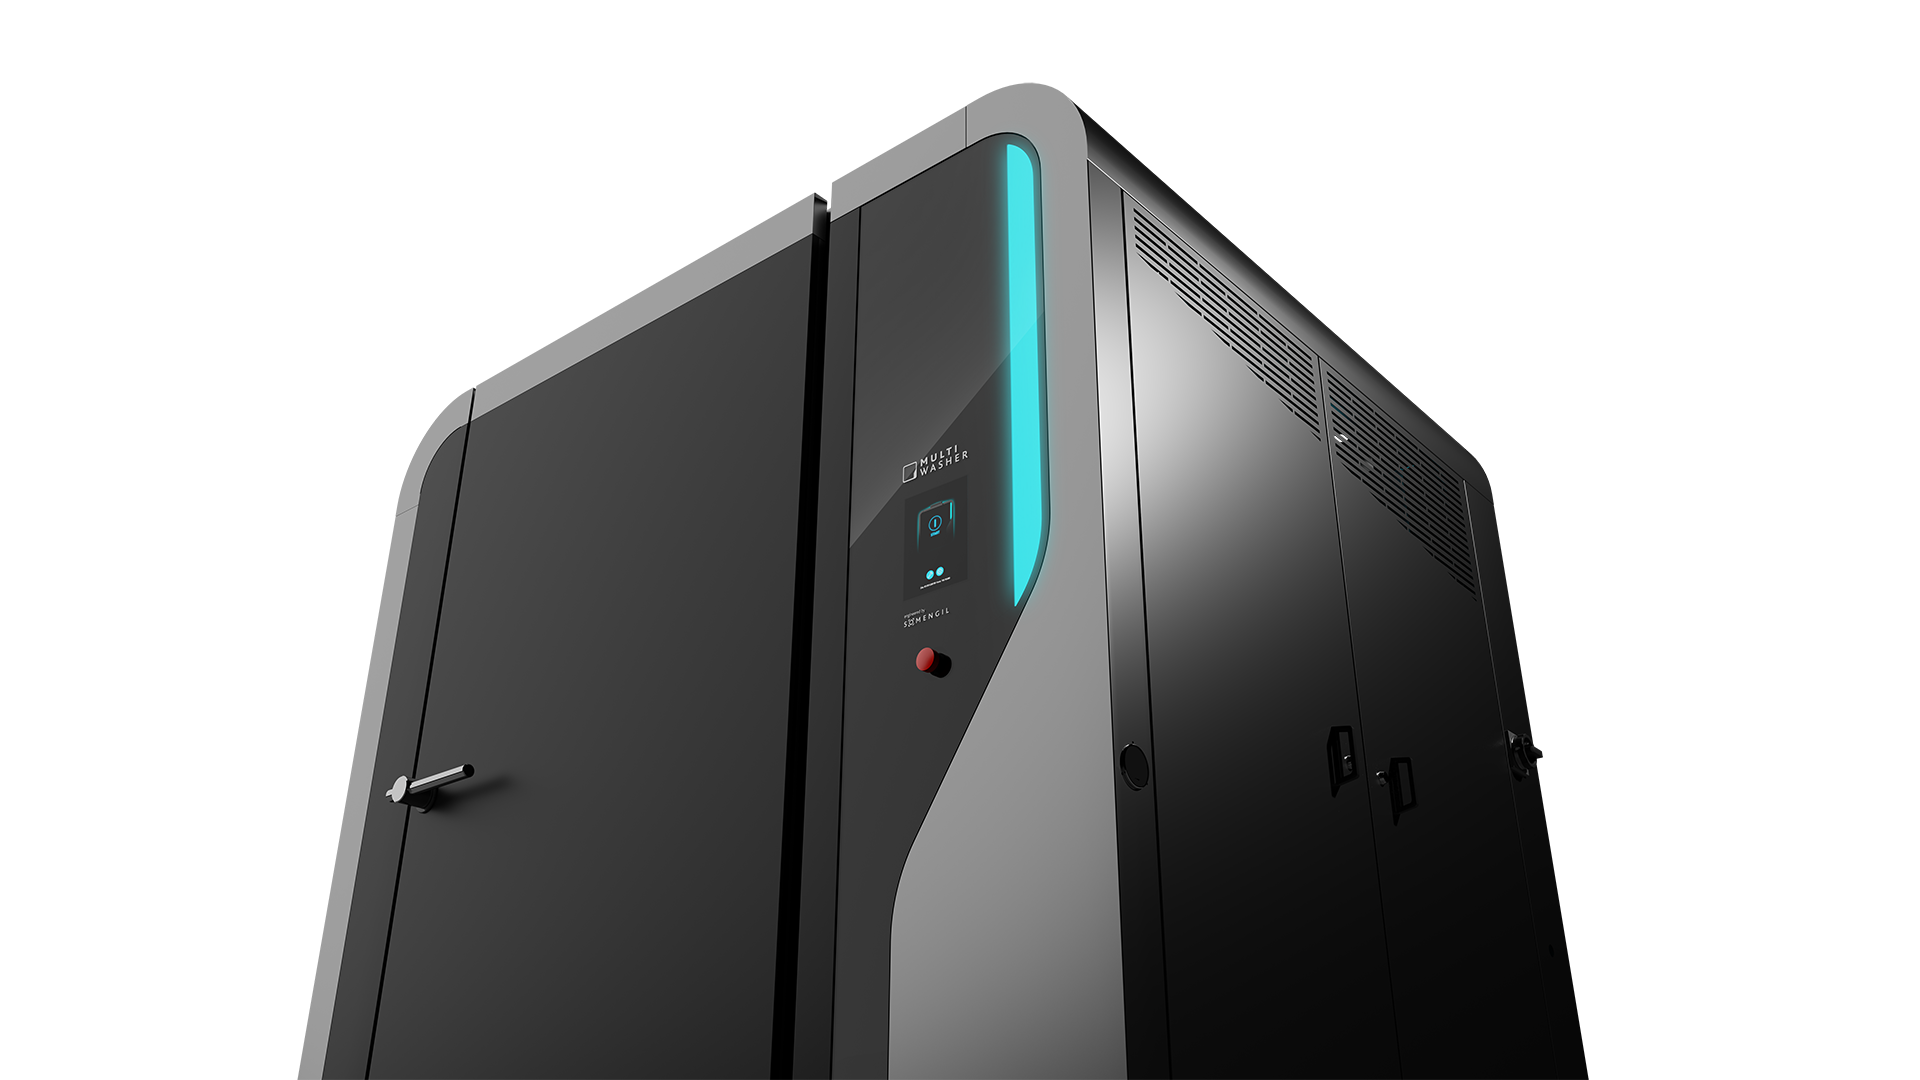
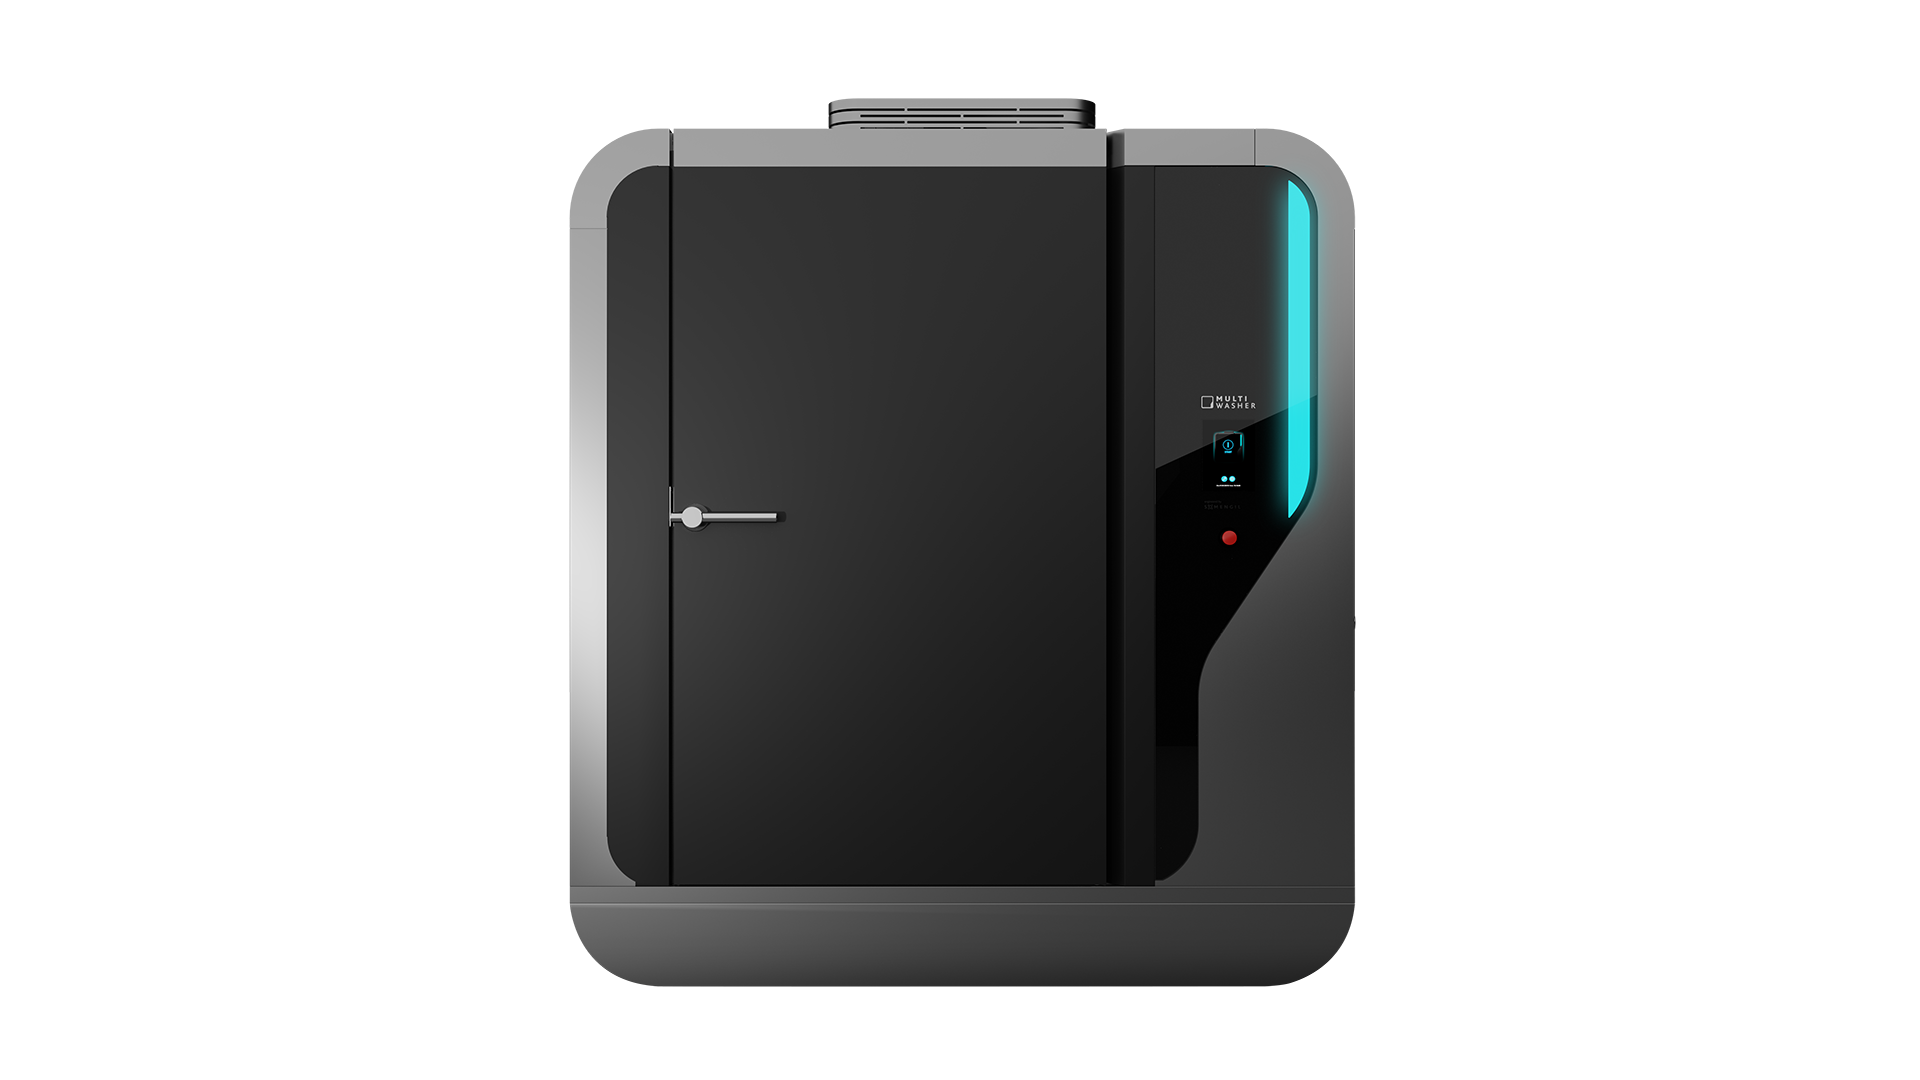
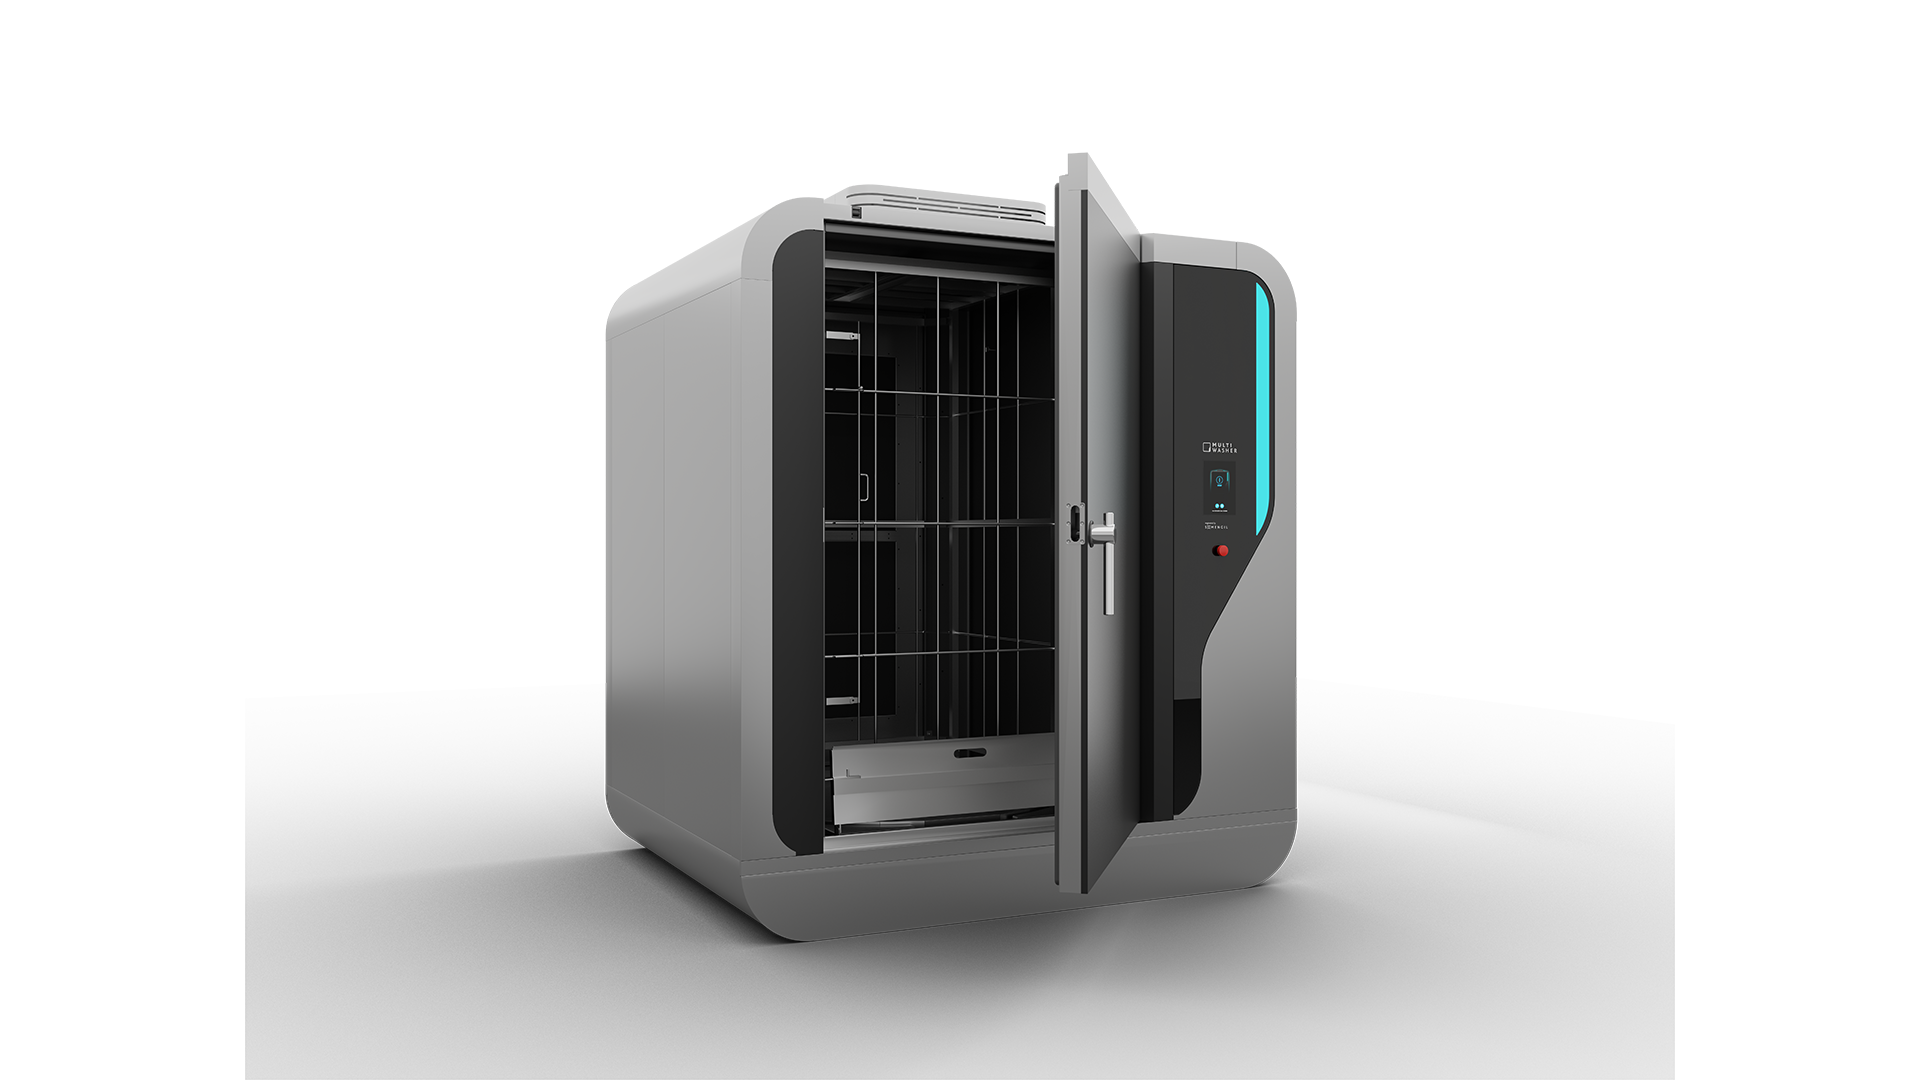
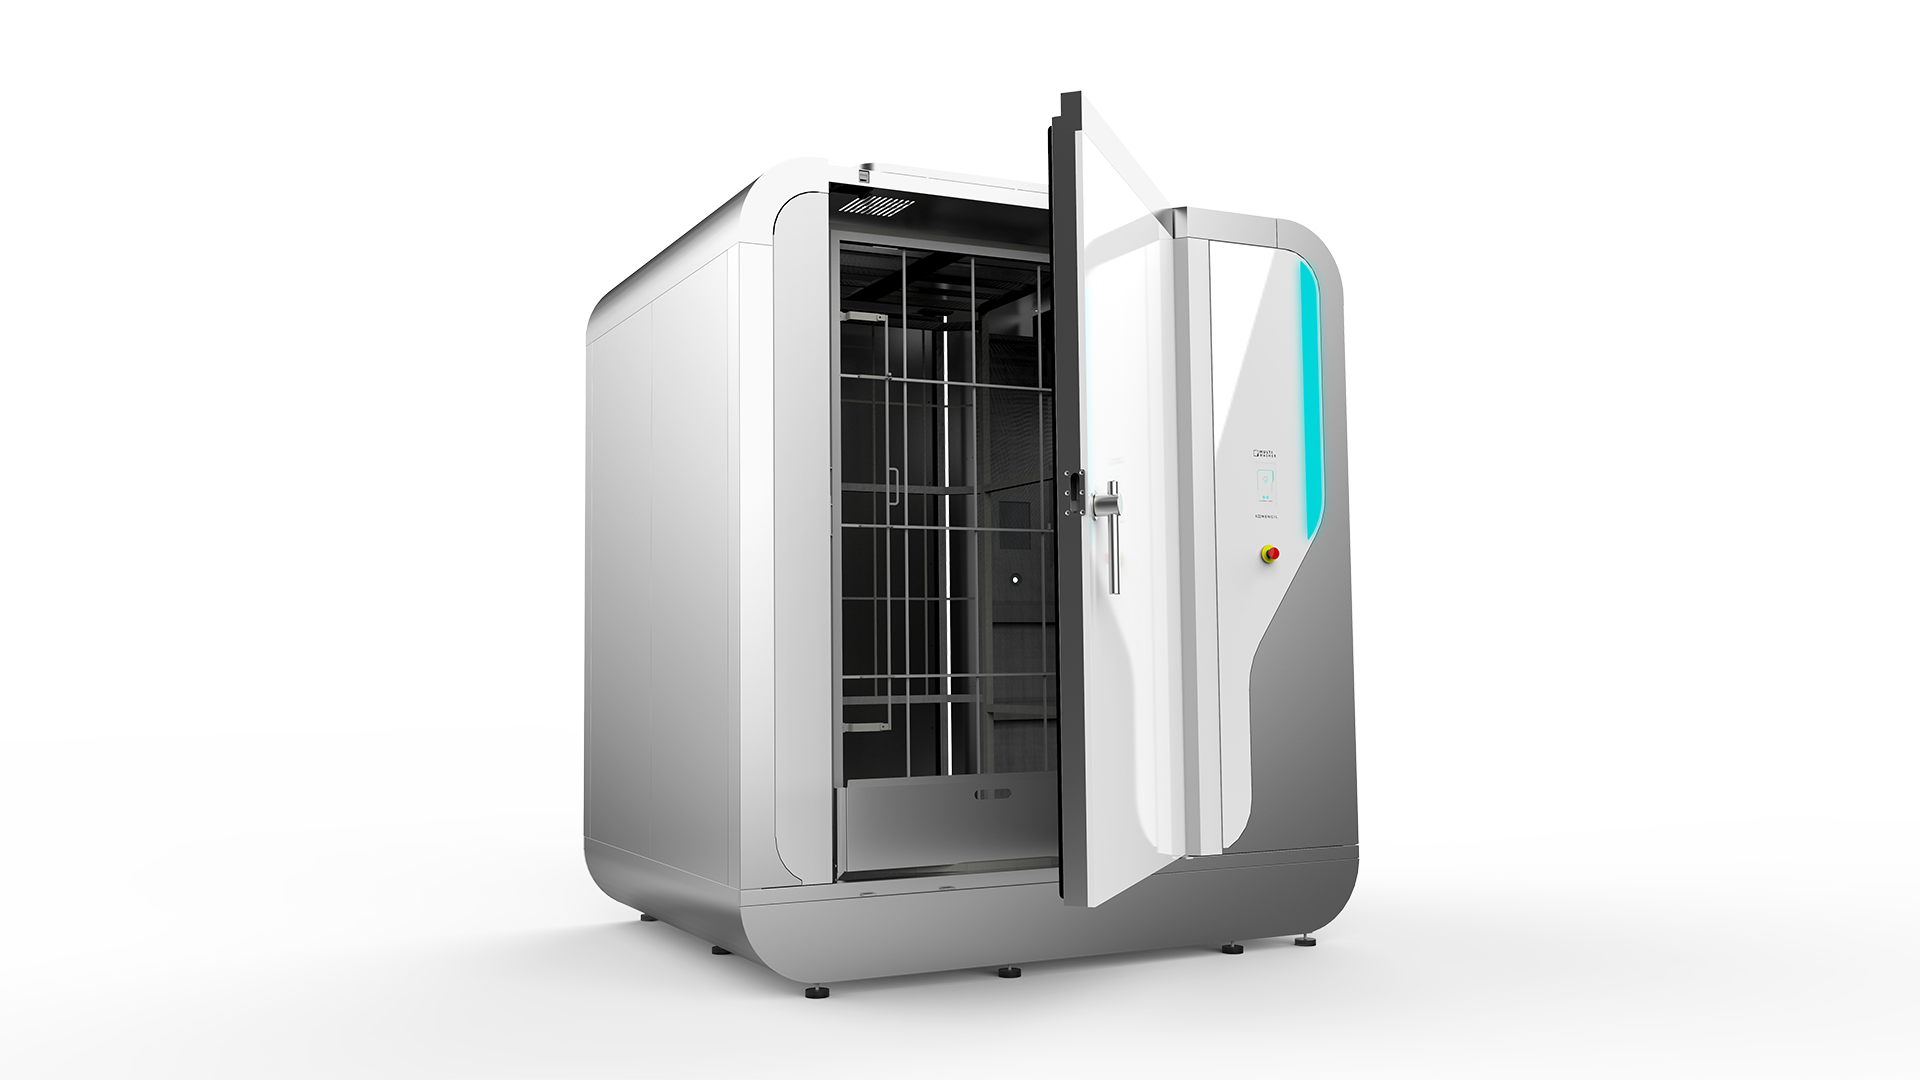
Continuous improvement is a habit and a way to be at the forefront of your industry. The Ishikawa Diagram is a widely used tool in continuous improvement efforts, but there are many others. Somengil helps companies achieve unprecedented levels of quality through MultiWasher, an industrial washing machine with high levels of water and electrical efficiency.
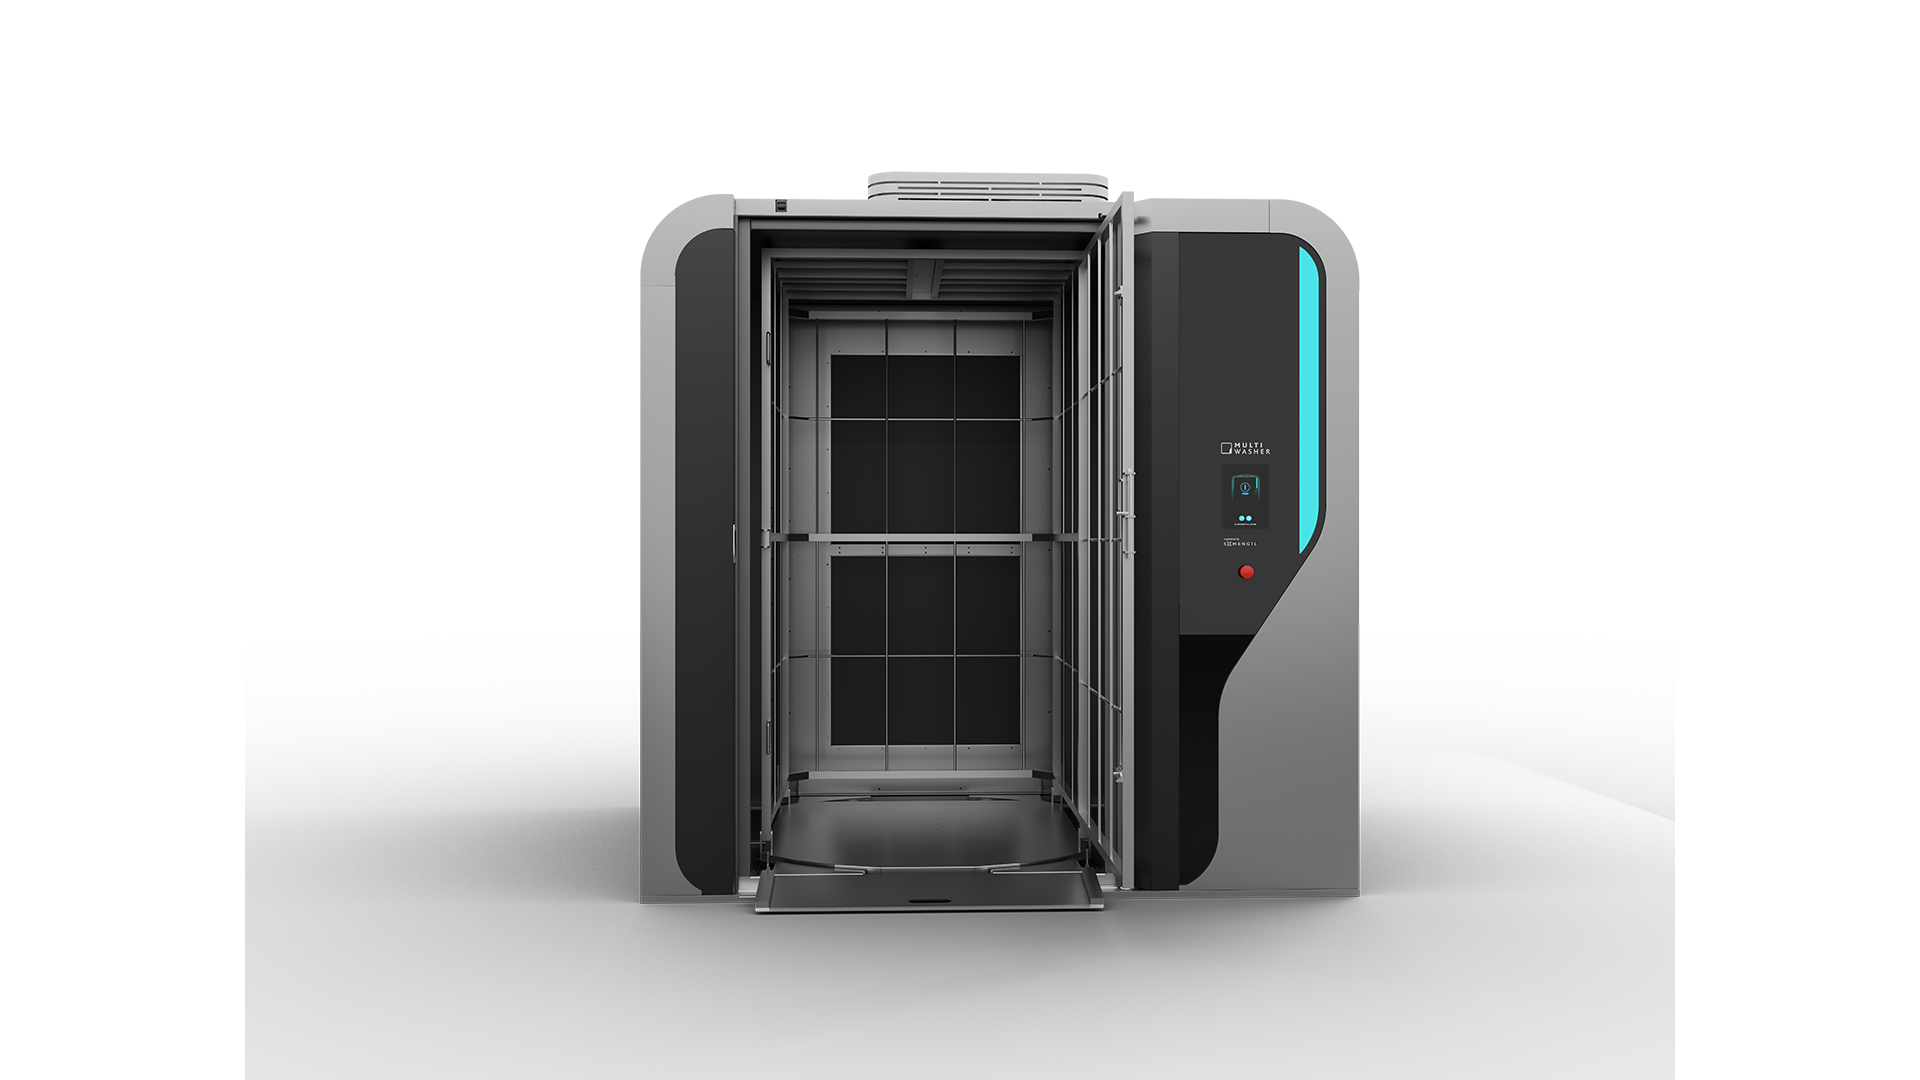
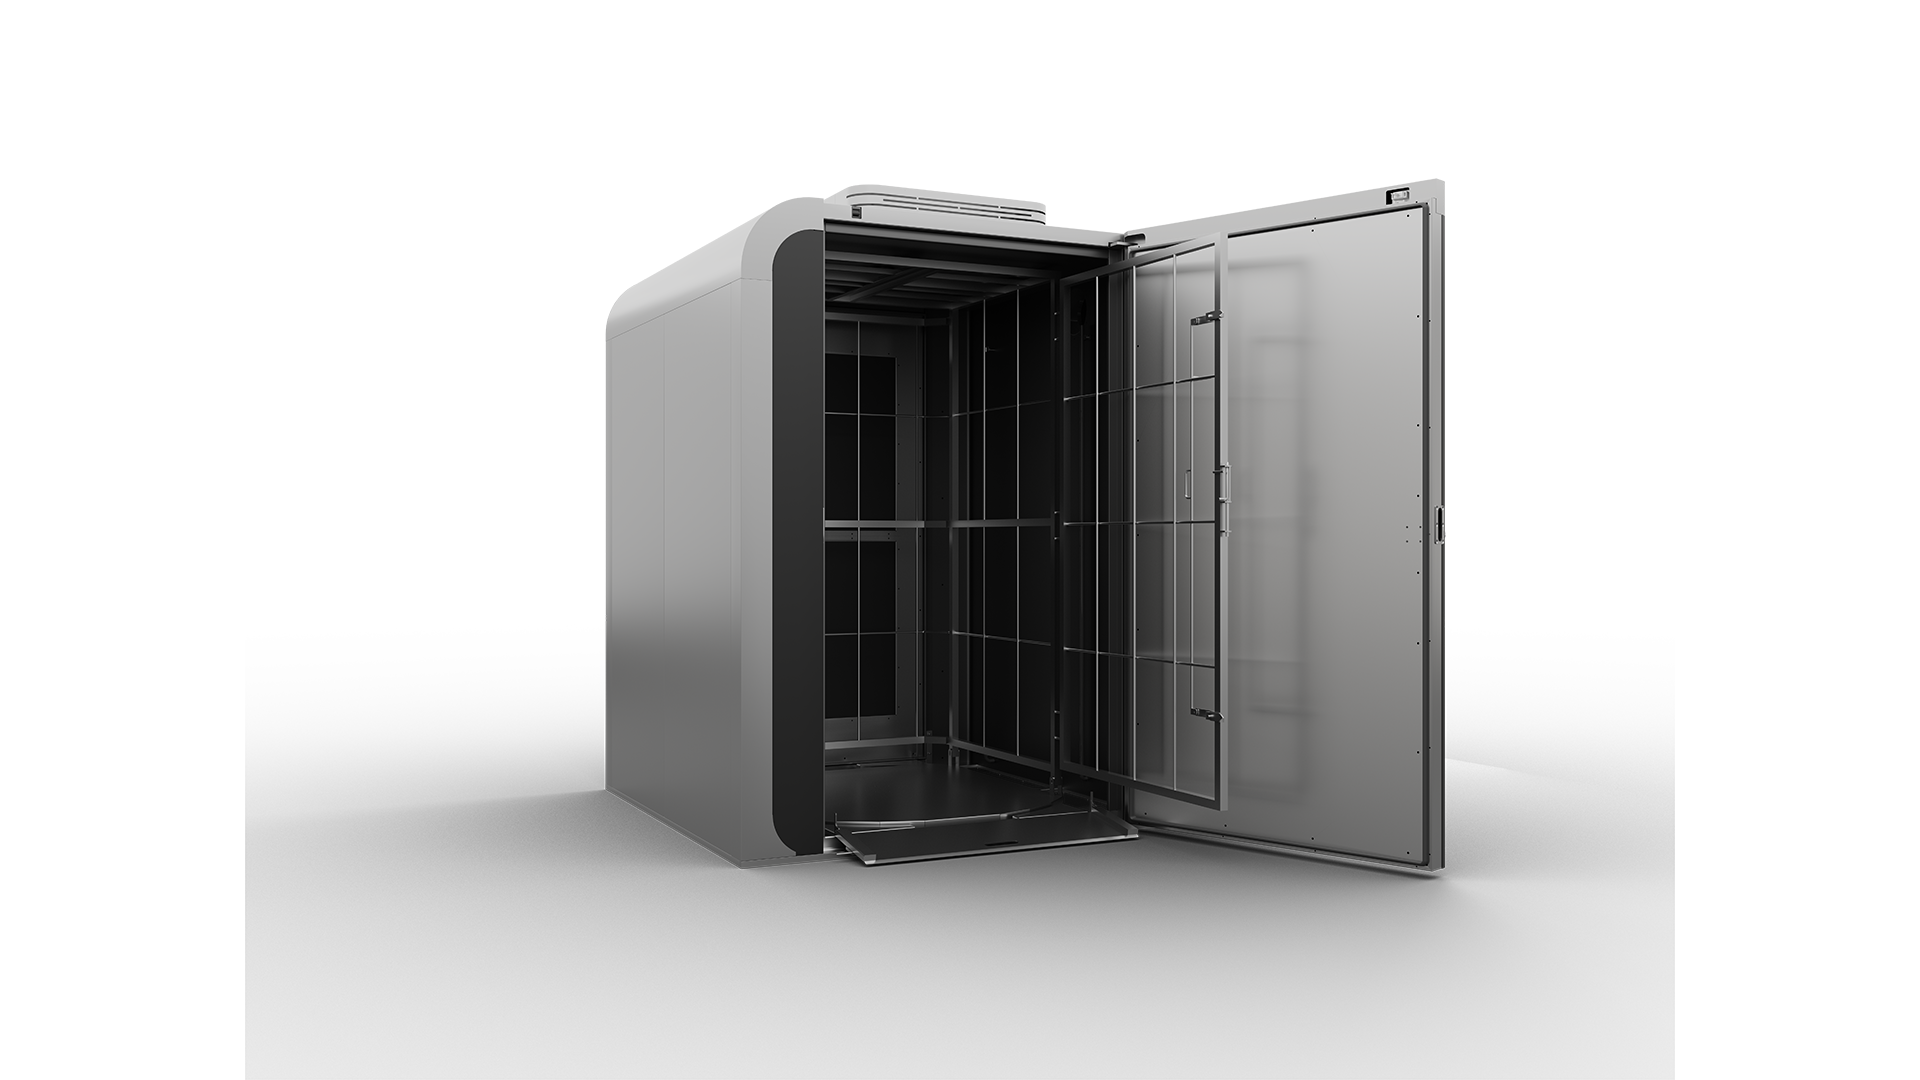
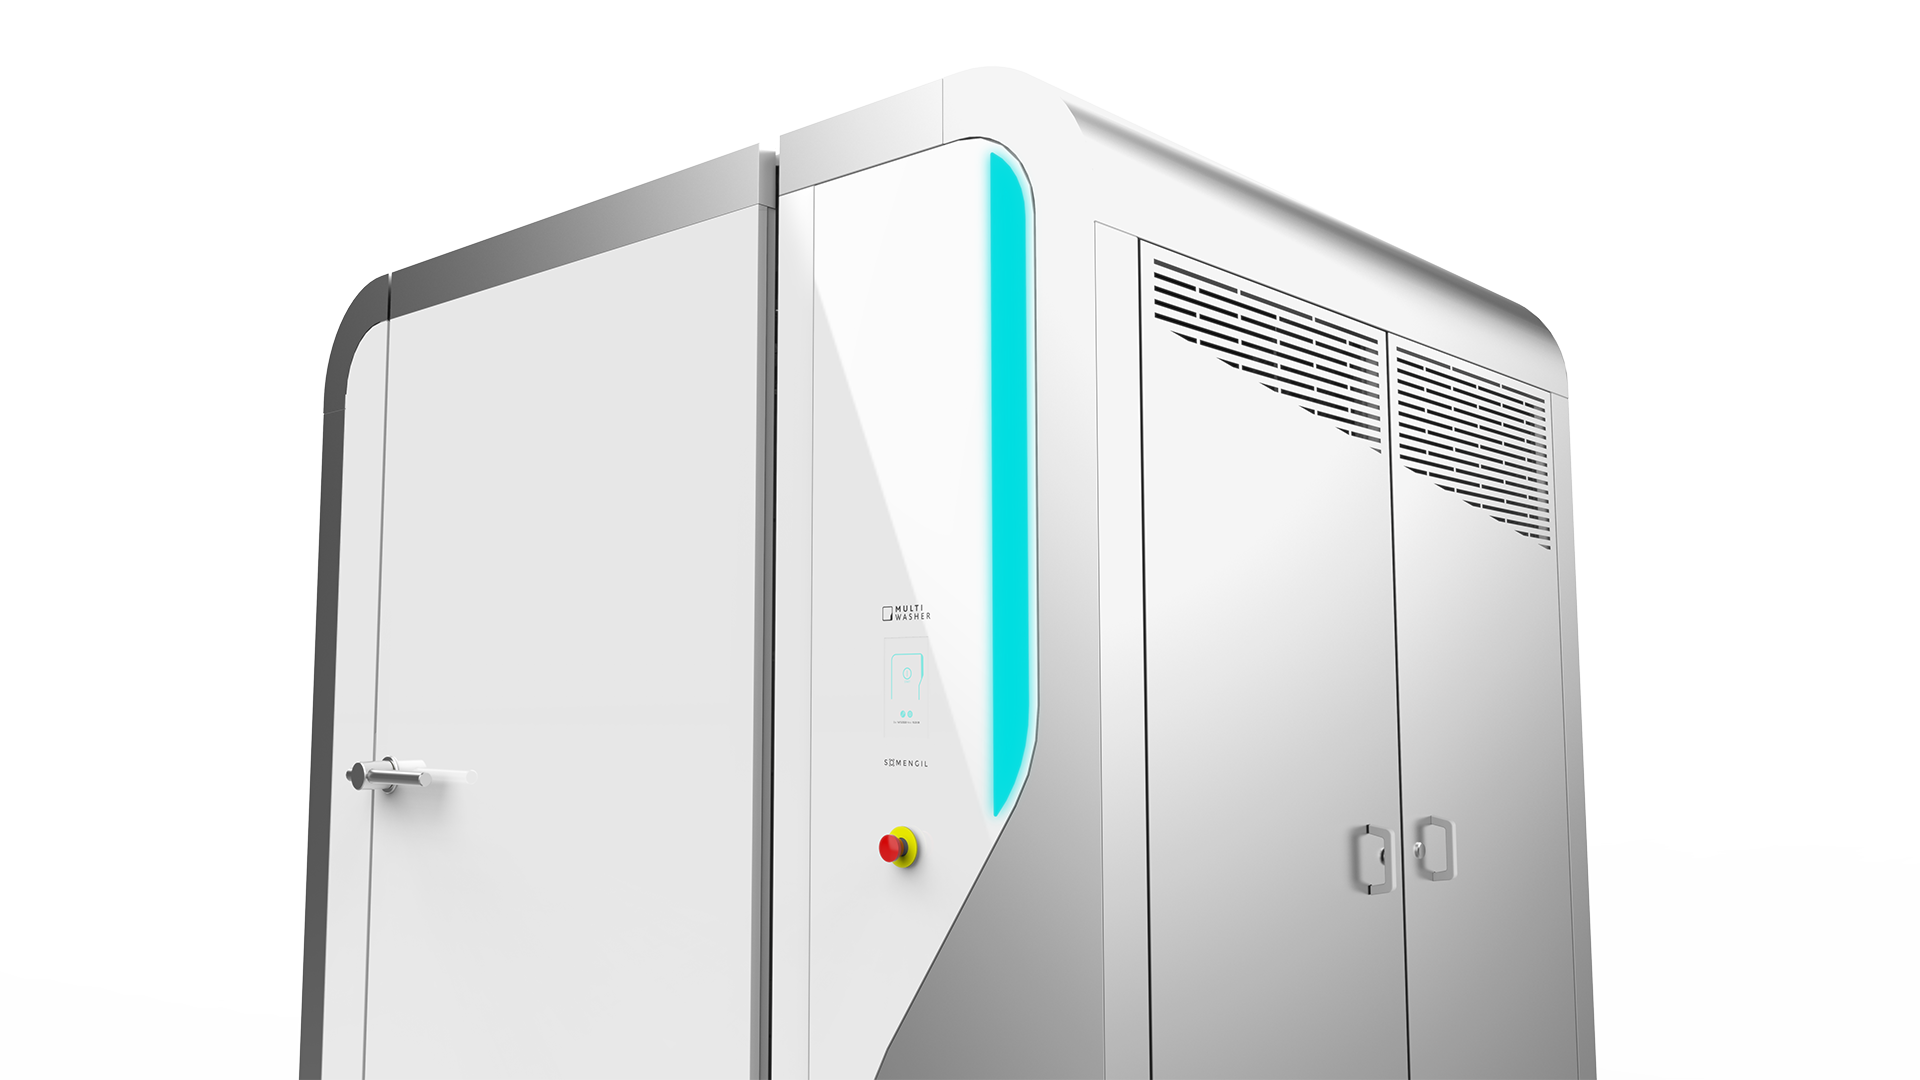
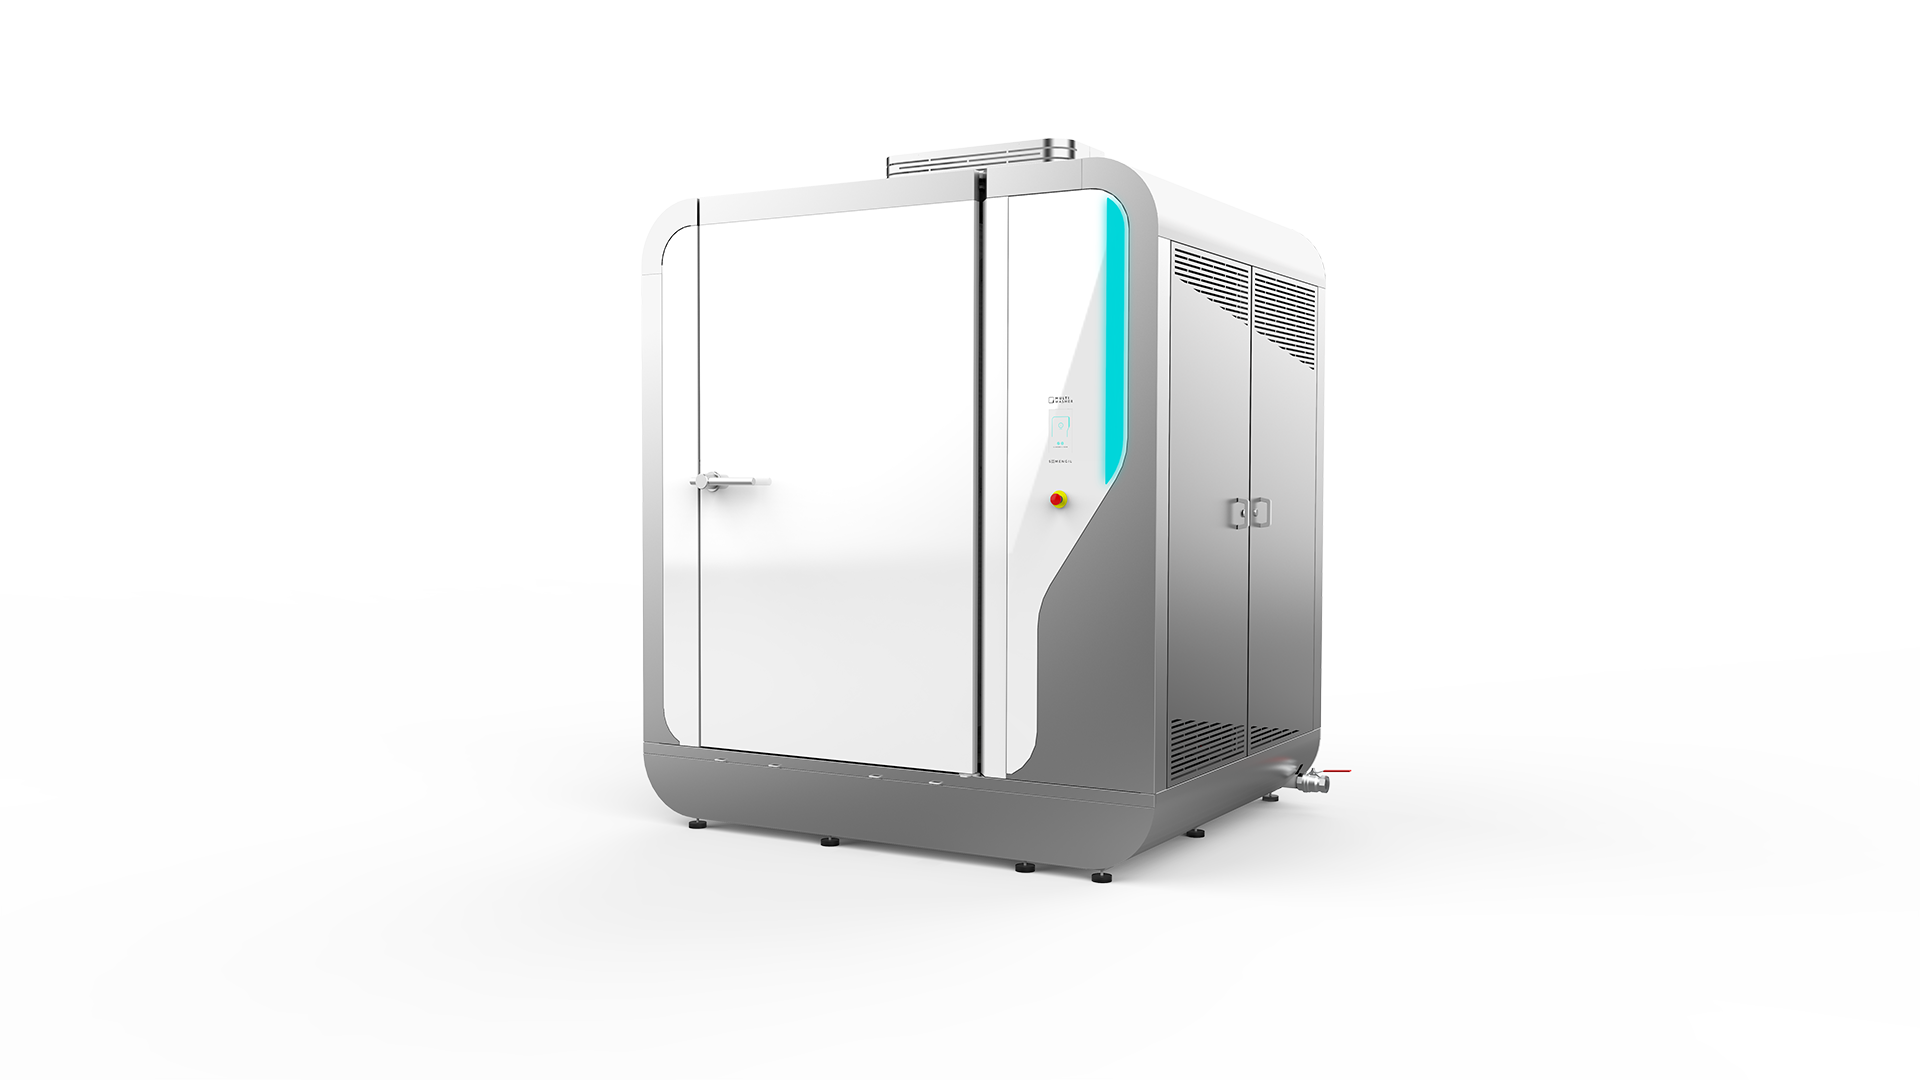
Very versatile, the MultiWasher washes all kinds of utensils, tools or vehicles, with a design that adapts to the processes and a system that is simple to use. If the root causes you detect in your Ishikawa Diagram need innovative and sustainable solutions, talk to our experts.
You may also like

Management / Articles
Sweet disposition: the importance of an efficient layout
The design of a business layout seeks to optimize the disposition of people and materials, ensure the efficiency of operations and avoid accident...
Posted in 2021-11-04

Management / Articles
What is industrial hygiene?
Industrial hygiene is an essential part of a happy, safe and productive workspace. But what exactly is this broad concept.
Posted in 2021-11-25

Management / Articles
8 indispensable quality tools
Here are 8 indispensable quality tools to create a culture of continuous improvement.
Posted in 2023-02-09















 Portugal
 United Kingdom
 United States
 France
 Spain
Spain Germany
 Romania
 Italy
Italy Czech Republic
 Finland
 Hungary
 Slovakia
 Greece
 Lithuania
 South Korea
 Russia
 Saudi Arabia
 Poland
 Brasil
 Hebrew